
On September 12 users from the United States will no longer be able to trade cryptocurrencies on Binance.
How do you think this will affect the Altcoins?
How do you think this will affect the Altcoins?
Anonymous Poll
44%
Alts will dump more
23%
Alts will bounce
33%
No effect
CryptoBullet
On September 12 users from the United States will no longer be able to trade cryptocurrencies on Binance.
How do you think this will affect the Altcoins?
How do you think this will affect the Altcoins?
📊 So, the majority of those who voted think that Alts will dump more the day that US customers have to leave Binance. And that’s a reasonable assumption since the US residents provide the liquidity, but something tells us that the least effect we should wait for is a Dump.
Why? It's been announced months ago and already priced in. The US customers have already migrated.
💡More likely nothing will happen and in a while alts will bounce.
Why? It's been announced months ago and already priced in. The US customers have already migrated.
💡More likely nothing will happen and in a while alts will bounce.
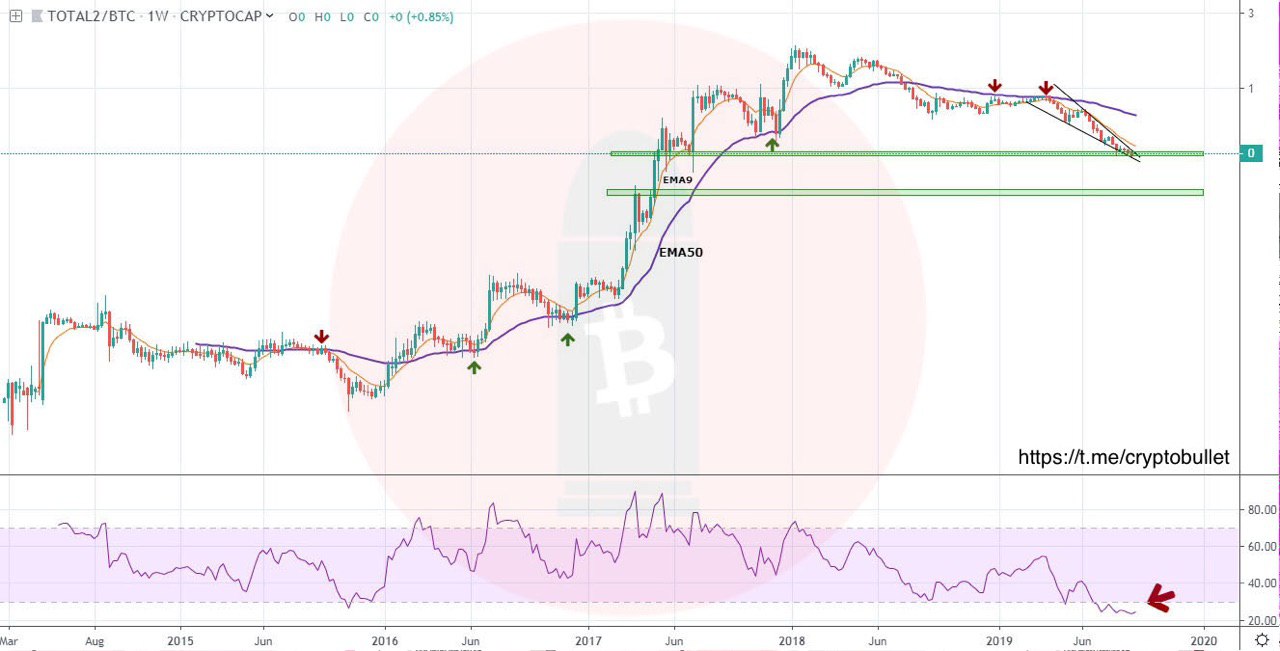
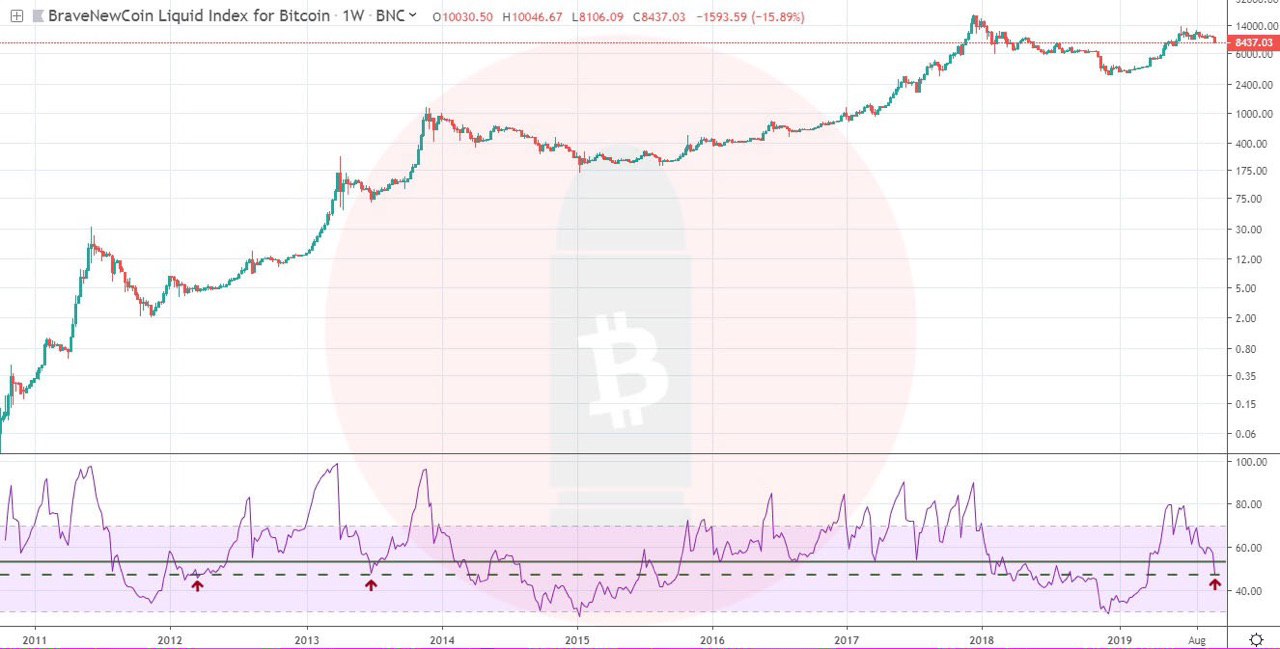
Let’s take a look at alt markets through Alts capitalization ratio to Bitcoin capitalization.
Alts/Bitcoin cap is sitting on its support. Weekly RSI is extremely oversold! We may see some bounce in coming weeks.
⚠️If the support breaks, the next stop is 40% down. So alts have to reverse right here in order to avoid (or delay) a very nasty drop relative to Bitcoin's cap before the next area of support.
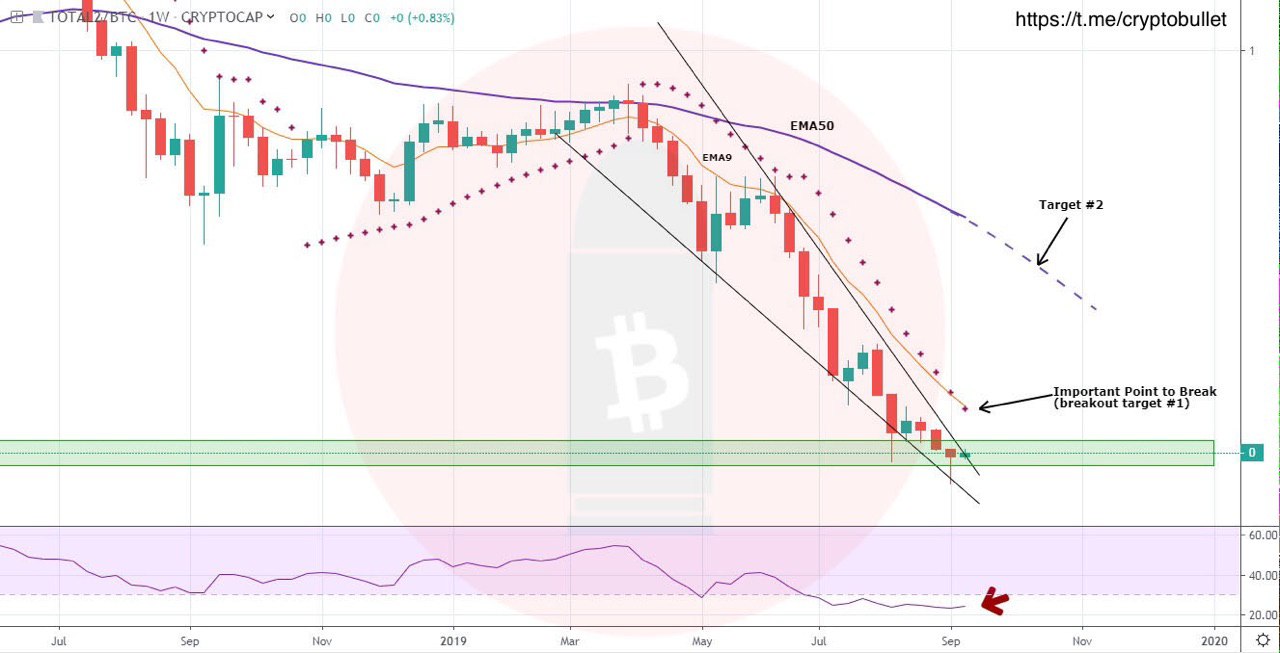
Let’s zoom in
The way we’ve approached the support is promising: Falling Wedge ends at the support on a hammer weekly candle, which favors the bulls. We need to see a clear breakout. Possible areas of rejection marked on the chart.
📌Bullish case condition - support has to hold
The way we’ve approached the support is promising: Falling Wedge ends at the support on a hammer weekly candle, which favors the bulls. We need to see a clear breakout. Possible areas of rejection marked on the chart.
📌Bullish case condition - support has to hold
CryptoBullet
BTC 4h update We were skeptical about the Golden Cross, because the fact that it occurred at the top of the triangle (resistance) diminished it's bullishness. We were right that this Golden Cross was irrelevant. Once we broke the 200 EMA, this thing accelerated…
So, like we expected, BTC goes lower.
The Golden Cross turned into the Death Cross and sub 10k here we come.
The Golden Cross turned into the Death Cross and sub 10k here we come.
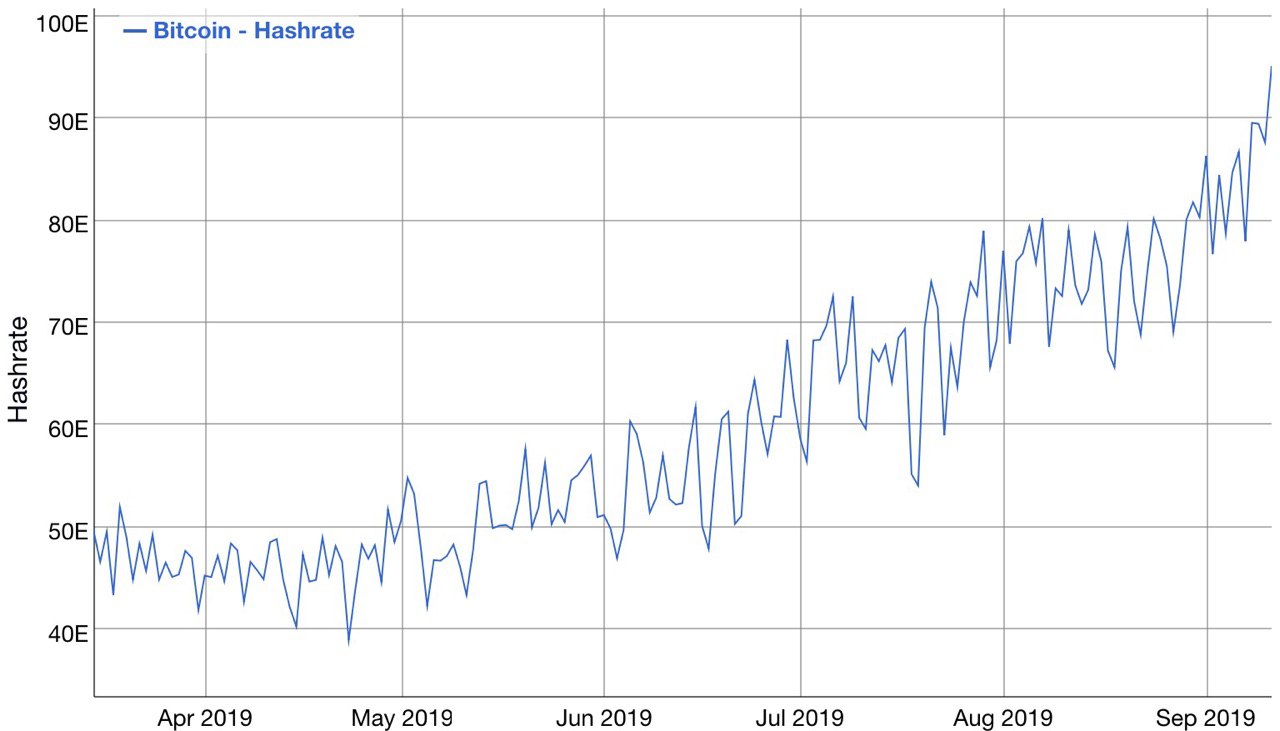
Bitcoin hashrate is at the new all-time high. 30% increase just over the past 30 days!
💡What you need to understand is that hashrate follows price. The longer Bitcoin stays at 10k, the more people want to take their mining hardware on line.
People who are running a mining farm have about 8 month left before the halving. They know their days are numbered. For every single day delay putting a miner on line it's a huge cost, because in 8 more month that miner will earn half the money.
So, everybody in the mining game is on a mission to get as much hash power on line right now as possible to get that 12.5 BTC reward for as long as possible before the halving.
BTC: The Decision Point is near!
https://www.tradingview.com/chart/BTCUSD/x8GLS9zr-BTC-The-Decision-Point-is-near/
❗️Don't forget to subscribe to our Trading View profile & press the like button. We would appreciate it.
https://www.tradingview.com/chart/BTCUSD/x8GLS9zr-BTC-The-Decision-Point-is-near/
❗️Don't forget to subscribe to our Trading View profile & press the like button. We would appreciate it.
Would you like to take a dive into on-chain analysis? To understand what it is and what's going on there
Anonymous Poll
81%
Yes
19%
No
What is on-chain analysis?
📌 [ On-chain analysis is the study of network metrics surrounding the blockchain and the capital flows moving on it ]
This is completely new analysis. Never before in finance we had such an asset with completely different volume analysis, because every coin is tracked and along with trading volume you can analyze the holding of that asset and how it privately changes hands.
On-chain Volume vs Volume on Exchanges
On-chain volume includes OTC. OTC (over-the-counter) purchases always clears onto the chain. Exchange volume does not. You can look at the volume going through the blockchain as an investment volume.
But the biggest problem with volume on exchanges is that we can’t reliably look at it since it’s faked. But you can't really fake onchain data, very difficult indeed.
Since almost no one is using on-chain metrics for trading purposes, there is no need to fake on-chain volume, and it's a lot more difficult: it's a lot of work and a lot more money is needed to do that.
And we continue diving into on-chain stuff
BTC: What does on-chain analysis tell us?
https://www.tradingview.com/chart/BTCUSD/pSoTQ9kv-BTC-What-does-on-chain-analysis-tell-us/
❗️Don't forget to subscribe to our Trading View profile & press the like button. We would appreciate it.
BTC: What does on-chain analysis tell us?
https://www.tradingview.com/chart/BTCUSD/pSoTQ9kv-BTC-What-does-on-chain-analysis-tell-us/
❗️Don't forget to subscribe to our Trading View profile & press the like button. We would appreciate it.
TradingView
BTC: What does on-chain analysis tell us? for BITSTAMP:BTCUSD by CryptoBullet
For those who are not familiar with on-chain stuff:
What is on-chain analysis?
On-chain analysis is the study of network metrics surrounding the blockchain and the capital flows moving on it.
This is completely new analysis. Never before in finance we had…
What is on-chain analysis?
On-chain analysis is the study of network metrics surrounding the blockchain and the capital flows moving on it.
This is completely new analysis. Never before in finance we had…
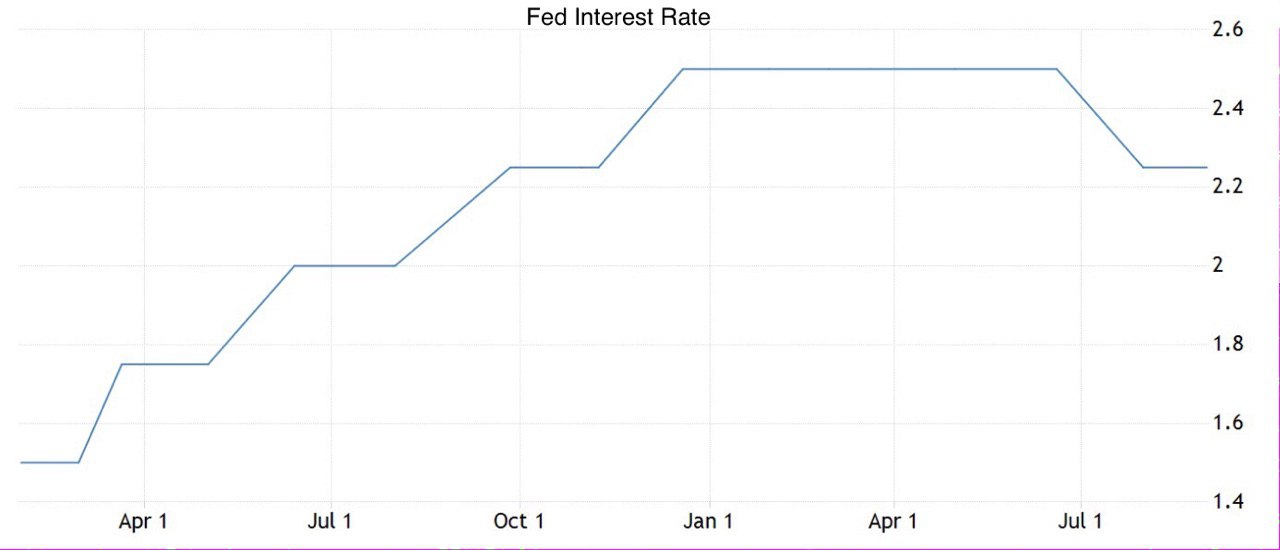
⌛️All markets, not only BTC, are waiting for the U.S. FED meeting today. The Federal Reserve is expected to cut interest rates.
The world is really racing to cut rates and some countries go even into negative rates. This is a long term bullish factor for Bitcoin.
But in the short term, if the FED cuts the rates by 0.25% or less, we can see a dump.
The world is really racing to cut rates and some countries go even into negative rates. This is a long term bullish factor for Bitcoin.
But in the short term, if the FED cuts the rates by 0.25% or less, we can see a dump.
CryptoBullet
Let’s take a look at alt markets through Alts capitalization ratio to Bitcoin capitalization. Alts/Bitcoin cap is sitting on its support. Weekly RSI is extremely oversold! We may see some bounce in coming weeks. ⚠️If the support breaks, the next stop…
Alts are pumping like we expected!
BTC: Buy the Dip Opportunity You Can’t Miss
https://www.tradingview.com/chart/BTCUSD/HbfYnACw-BTC-Buy-the-Dip-Opportunity-You-Can-t-Miss/
❗️Don't forget to subscribe to our Trading View profile & press the like button. We would appreciate it.
https://www.tradingview.com/chart/BTCUSD/HbfYnACw-BTC-Buy-the-Dip-Opportunity-You-Can-t-Miss/
❗️Don't forget to subscribe to our Trading View profile & press the like button. We would appreciate it.
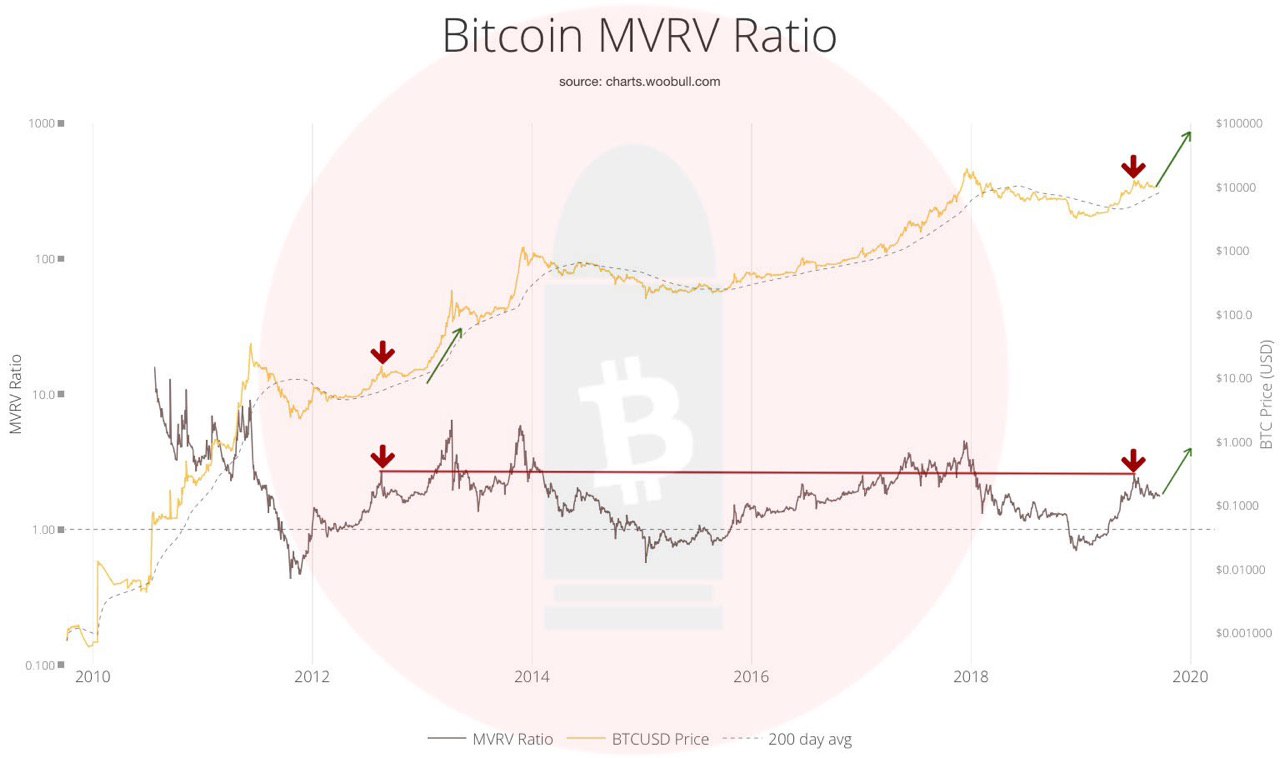
More of on-chain analysis: Bitcoin MVRV ratio
What is the MVRV ratio?
[ MVRV is calculated by simply dividing market value by realized value on a daily basis ]
Market value - total market capitalization (latest BTCUSD trading price multiplied by the number of bitcoins mined thus far)
Realized value is found not by counting all mined coins equally at current price, but rather assigning them a $ price based on the time when they were last moved.
It is of particular interest whenever market value goes below a 1:1 ratio to realized value.
💡The current bull run looks more like 2012-2013 not only by its price action, but also by MVRV ratio. Although the level of MVRV is not unusual, we never saw a rise this big since 2013! In August 2012 MVRV moved up to the level where we are today and then another parabolic move happened.
So, according to this metric, the first take to the bull market is just about to complete and the second act is about to start in the Q4 (October-December).
#BTC
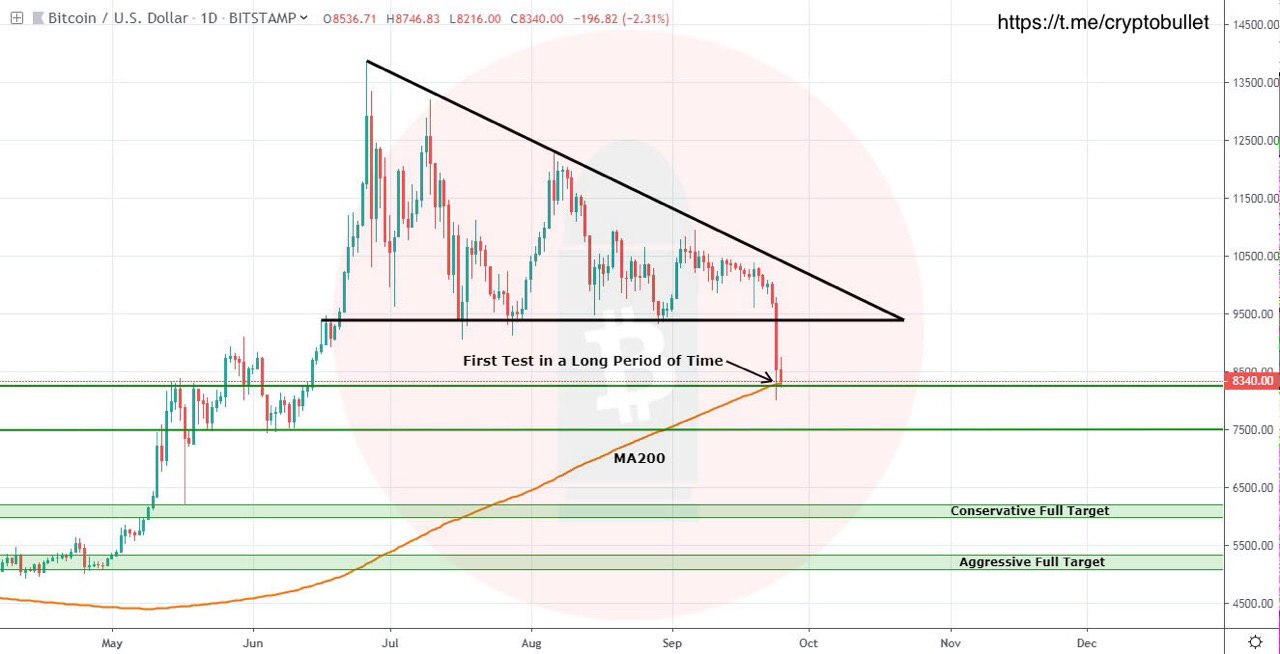
For 3 month we've been watching this descending triangle pattern form and it finally broke down.
The price found support at the 200-Day MA, which is in line with a horizontal support. It's the first test of it since being away from it for a long period of time, so we can hope for a relief rally until we close below the 200 DMA.
⚠️The Descending Triangle as a pattern has its breakdown target. Full measured move out of the descending triangle is ~ 5k (aggressive target). Does it have to go that low? Of course not, but keep that in mind.
If we break the 200-Day MA, the price probably will stop in mid 7ks.
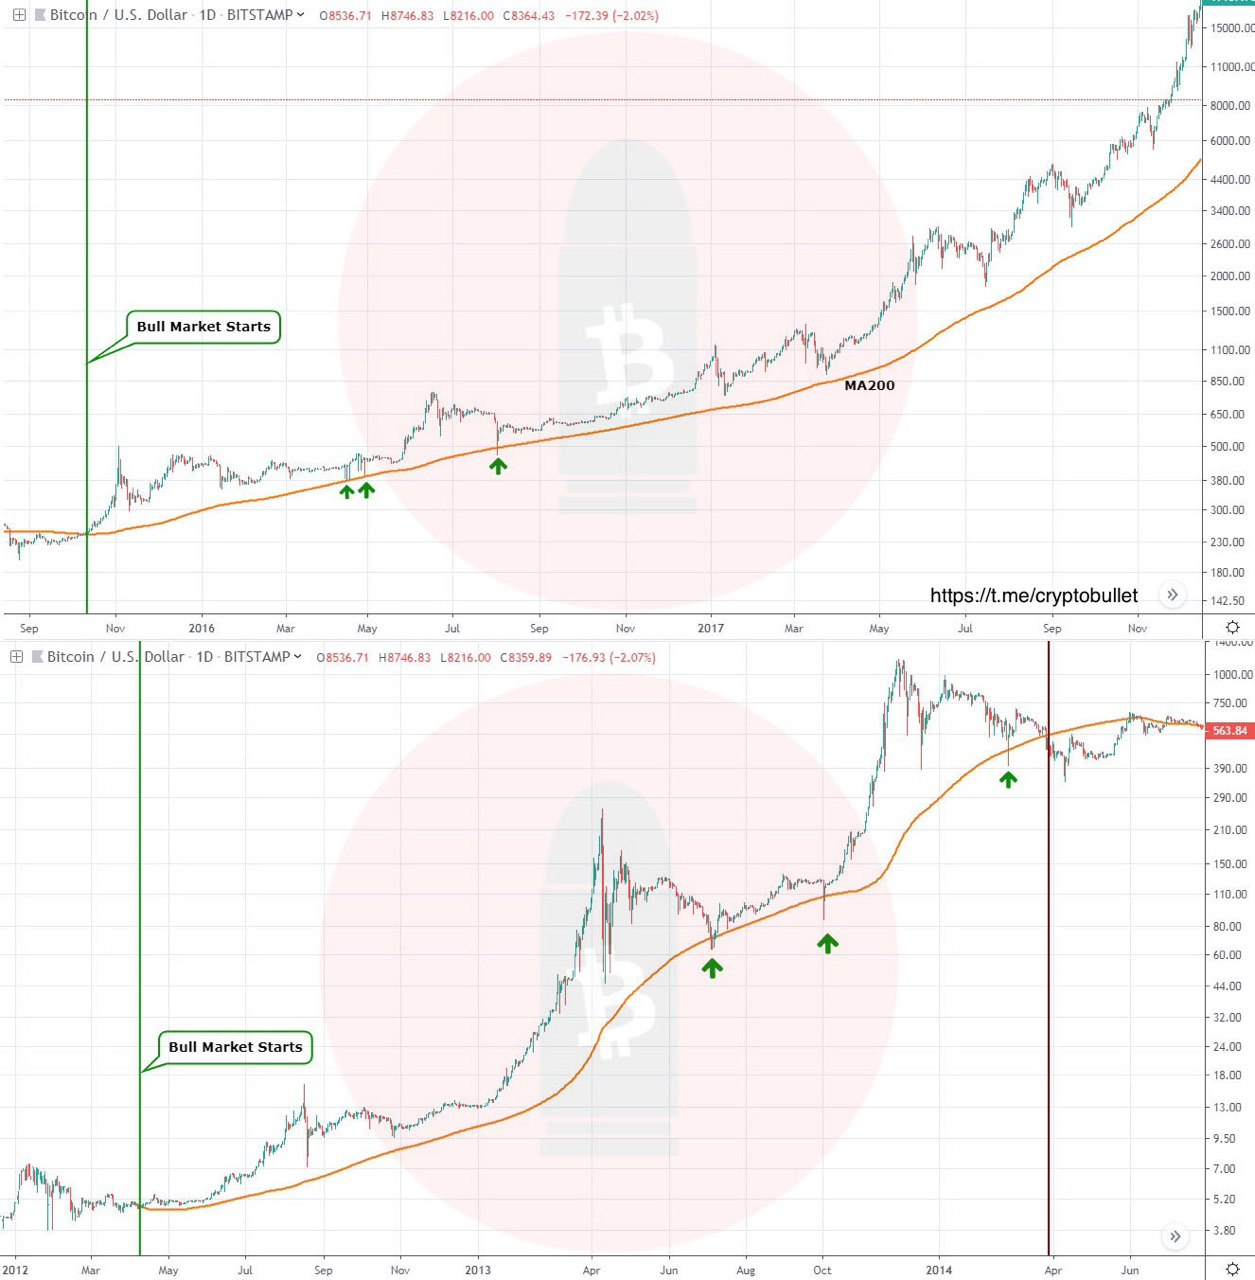
The 200-Day MA is very important in a bull market.
There were some short-lived touches in 2016 and 2013. We’ve never had a weekly close below the 200-Day MA in a bull market.
In August of 2016 we fell 6% below it on a wick;
In February of 2014 we fell 13% below it on a wick;
In July of 2013 we fell 10% below it and even opened & closed a full daily candle below it before a swift rebound;
In October of 2013 we dipped below it again but didn’t print a full candle under the 200-Day MA.
📌 A close below a critical moving average doesn't mean much. It's all about an entire body of a candle opening and closing below that MA, but even this can be tricky (look at the price action in July of 2013). If we get a full candle below the 200-Day MA, that will be a point of concern.
Here is a nice support line on the weekly RSI during bull trends.
👉 Every time we came down and test that support on the RSI, it was a local bottom during 2016-2017 bull cycle. It was also relevant in 2012-2013 uptrend.
Bitcoin cut through the first and very obvious support line and now sitting at the second one - this is the last hope of the bulls. Needs to rally back up. The weekly close is going to be very important.
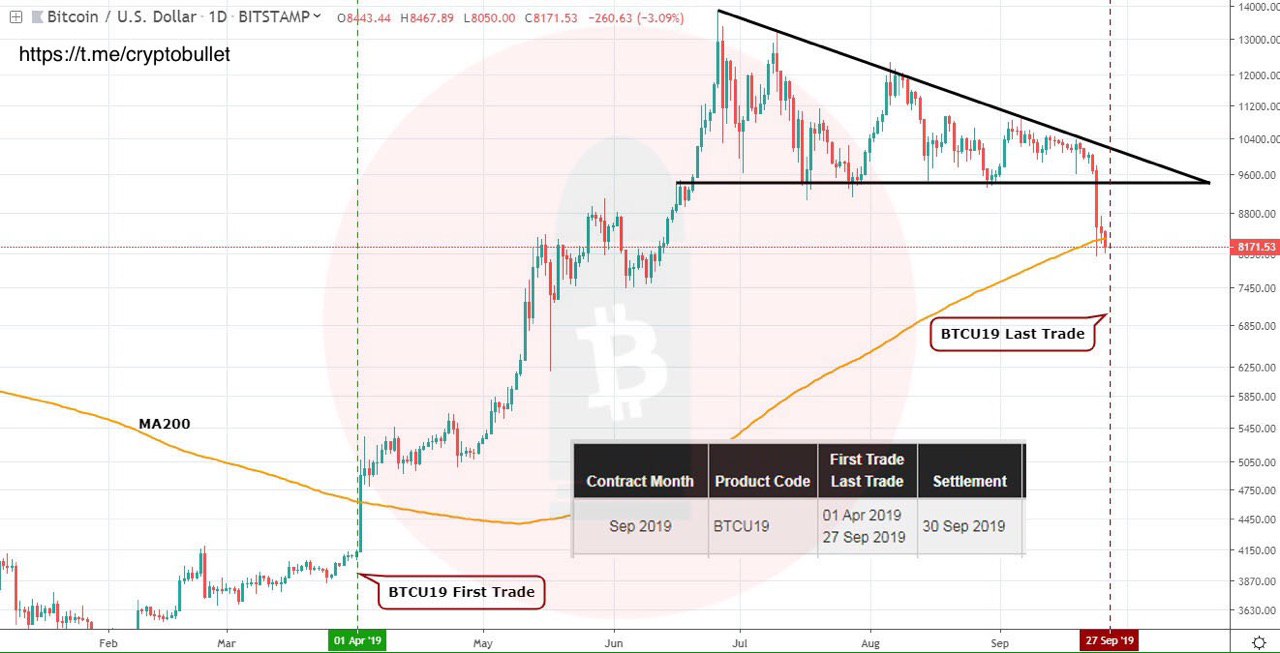
CME Futures are expiring tomorrow at 4:00 PM London time (3:00 PM UTC time)
Here is an important point: these are half-yearly Futures and they were opened on April 1, right before that $1k pump that kicked off the bull run.
Expecting high volatility around the expiration, beware of darth maul candles. Tomorrow can be a pivot point to the upside, but if not... and we break the 200-Day MA, this will get ugly.